Testing and benchmarks
"Drop-in" is a claim, so wxingress checks it. Two scripts in dataplane/e2e/ run on a kind cluster and
compare wxingress with ingress-nginx and with RKE2's rke2-ingress-nginx:
ingress-nginx-parity.shsends the same requests to each controller and compares the answers, then switches a cluster from rke2-ingress-nginx to wxingress under load, following the RKE2 runbook, and counts every failed request.ingress-nginx-bench.shmeasures throughput, latency, CPU and memory of each controller on the same node, Ingresses and backends.
Both use the same corpus of 97 Ingresses in dataplane/e2e/corpus/. Run them yourself against any tag.
The same answers, and the switch
dataplane/e2e/ingress-nginx-parity.sh installs, on a kind cluster with
the controller as a hostPort DaemonSet, ingress-nginx 4.15.1 and
rke2-ingress-nginx 4.12.600 (rancher/nginx-ingress-controller:v1.12.6-hardened1,
release rke2-ingress-nginx in kube-system, its webhook with
failurePolicy: Fail, as RKE2 runs it), sends the same probes to each, then
follows the RKE2 runbook to wxingress under load and sends them
again. The corpus is 97 Ingresses: the anonymised Ingresses of a production RKE2 cluster, those
the charts of GitLab, Collabora, Argo CD, Keycloak and oauth2-proxy render,
and one per annotation of ingress-nginx's own e2e suite, cert-manager's
solvers with and without a class among them (dataplane/e2e/corpus/). Each
path is probed exactly, with a slash, below, beyond its boundary, in upper
case, over http and https, as a WebSocket upgrade, a CORS preflight and
request, with forwarded headers of the client, basic credentials, a canary
header and a body over the default limit: 2562 probes, each recorded as the
status, the headers that tell behaviour, the certificate (the host's or a
default one) and what the backend saw.
Last run (2026-11-04, one node):
| against | alike | allowed | inconclusive | failing |
|---|---|---|---|---|
| rke2-ingress-nginx 1.12.6 | 2511 | 51 | 0 | 0 |
| ingress-nginx 1.15.1 | 2511 | 51 | 0 | 0 |
The allowed differences are listed with their reason in
dataplane/e2e/ingress-nginx-parity.allow: gRPC's error pages, the body of
the WebSocket echo - which is the corpus canary's backend too, so its body
differs per request on every host that shares the canary's primary Service
(the canary is one of the upstream, as ingress-nginx's) - HSTS on app-root's
redirect, a path beyond a solver's token. The canary of an upstream and the
413 before the redirect to https, allowed before, are now ingress-nginx's.
What the runs found and wxingress now does as ingress-nginx: every host over
https, with the default certificate where its Ingresses have no TLS (plain
http stays plain there); a gRPC host's plain http sent to https; a Service
without endpoints sent to default-backend with ingress-nginx's headers
(X-Code: 503, the forwarded headers, the upgrade); HSTS on the default
server's https.
The switch under load: a restart of the rke2-ingress-nginx DaemonSet with its
RollingUpdate - which the affinity of step 1 would cause - lost about 10 000
requests on the node while its pod restarted; with updateStrategy: OnDelete
in the same change (step 1), the node out of the balancer before it is
switched, and wxingress's own restarts done node by node (strategy:
OnDelete in the example values), 68 297 requests went through all of the
runbook - steps 1 to 7, wxingress's webhook installed with Ignore, made
Fail and checked (every Ingress of the corpus admitted, an invalid one
refused), rke2-ingress-nginx's gone, rke2-ingress-nginx uninstalled, the
IngressClass taken over - with none failed. That run had one node: while it
was out of the balancer, no request was sent.
With four nodes (2026-11-16, kind 1 control plane + 3 workers, all running
the controller; LB=haproxy): a haproxy in front of the nodes' hostPorts
(TCP, round robin) whose servers the run drains and readies with the runbook,
and wrk with keepalive through it over http and https (16 connections each)
beside the probe load, both counted per phase. Each node is switched while
the other three take its traffic; the first one goes back to
rke2-ingress-nginx and over again ("The way back for one node"); each
switched node answers its 2562 probes as rke2-ingress-nginx did before
(failing 0). Through steps 1 to 7: 205 482 requests of the probe load and
2 195 141 of wrk, none failed. BACK=1 goes the whole way back instead of
step 7 (rke2-ingress-nginx's webhook back with Ignore, every node back,
Fail, wxingress uninstalled): 230 414 and 2 287 635, none failed; there
rke2-ingress-nginx, back, now and then misses the probes' 5 s on Argo CD's
https paths (the 502 of an HTTPS backend that speaks no TLS, which it
answered within it before) - against itself, not a difference of wxingress. The
RollingUpdate restart the runbook avoids lost about 6 300 of the probe load's
and 33 000 of wrk's requests on four nodes. Not counted: the Ingress the run
writes reloads nginx on every node, and a reload closes the idle keepalive
connections, so a request sent on one as it closes gets a read error (0 to 3
per run) - nginx's reload, rke2-ingress-nginx's alike: 11 reloads under the
same wrk against one node, 27 read errors for rke2-ingress-nginx, 17 for
wxingress. A browser sends such a request again.
What it costs: the benchmark
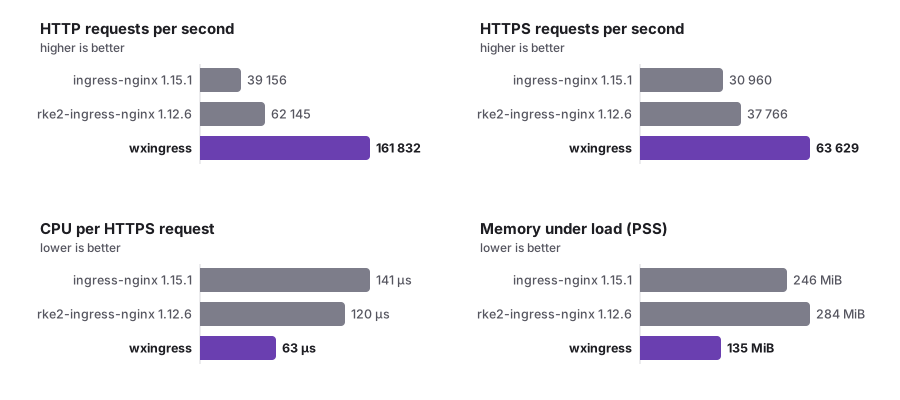
dataplane/e2e/ingress-nginx-bench.sh runs on the same kind node, the same
backends and the same 97 Ingresses of the parity corpus, one controller at
a time as the hostPort DaemonSet, each installed fresh: ingress-nginx 4.15.1
with its default metrics on, rke2-ingress-nginx 4.12.600
(rancher/nginx-ingress-controller:v1.12.6-hardened1, RKE2's values, metrics
on, no admission webhook) and wxingress with deployments/rke2-cutover/values.yaml
(the compatibility profile, -dynamic-upstreams, ingress-nginx's metrics
on, its admission webhook on). nginx has 4
workers pinned to the same 4 CPUs in each; wrk (8 threads, 64 keepalive
connections) runs pinned to 16 others against a backend that costs nothing.
CPU per request is the user and system time of every process of the pod -
nginx and the controller - over the run, divided by the requests; memory is
the PSS of the pod's processes.
Last run (one kind node, 97 Ingresses): ingress-nginx and rke2 of
2026-11-03, each value one run; wxingress of 2026-11-15 on 28f9fe23e, the
median of 5 runs (RUNS=5), after the latency summary, the canary per
upstream, the redirect to https per location and the admission webhook had
landed. Memory varies by 2-3 MiB between runs of the same controller.
| ingress-nginx 4.15.1 | rke2-ingress-nginx 1.12.6 | wxingress | |
|---|---|---|---|
| http req/s | 39 156 | 62 145 | 161 832 |
| http p50 / p99 ms | 1.68 / 4.69 | 0.93 / 4.54 | 0.381 / 0.598 |
| http CPU µs per request | 106.33 | 71.87 | 24.72 |
| https req/s | 30 960 | 37 766 | 63 629 |
| https p50 / p99 ms | 1.98 / 5.57 | 1.57 / 6.53 | 0.98 / 1.48 |
| https CPU µs per request | 140.87 | 120.47 | 62.85 |
| memory at rest / loaded (PSS MiB) | 132 / 246 | 134 / 284 | 128 / 135 |
| memory after the Ingress churn (PSS MiB) | 144 | 167 | 155 |
| endpoint churn: reloads | 0 | 0 | 0 |
| endpoint churn: controller CPU s | 28.83 | 42.31 | 0.16 |
| endpoint churn: errors, p99 ms | 0, 5.79 | 0, 4.26 | 0, 0.619 |
| Ingress churn: reloads | 20 | 20 | 20 |
| Ingress churn: controller CPU s | 30.66 | 41.86 | 0.77 |
| Ingress churn: wrk read errors, p99 ms | 1062, 4.89 | 1074, 4.97 | 947, 0.94 |
| new Ingress to its first answer (median s) | 3.232 | 3.244 | 3.183 |
Before the changes of the "Memory" point below, the same run gave wxingress
155-161 MiB at rest, and 3.52 s to a new Ingress's first answer: the reload
interval counted from the end of a reload instead of its start, and each
reload parsed the configuration twice more than it needs to (nginx -s
reload before the master, and nginx -t of a file nothing had changed).
Against wxingress's run of 2026-11-03 (751b5330a, one run each: 23.68 and
61.01 µs, 168 963 and 65 557 req/s, 126 / 131 / 146 MiB, 0.38 s controller
CPU in the Ingress churn) a request over https costs the same; over http the
median is 1 µs more (+4 %) and the req/s 4 % fewer, inside the range of the
five runs (23.88-26.16 µs) and about what ingress-nginx's req/s lost on the
same day. Memory at rest and loaded is 2-4 MiB more. Two rows moved further,
both mostly from the admission webhook that deployments/rke2-cutover/values.yaml
now turns on (failurePolicy Fail) while the benchmark installs ingress-nginx
and rke2 without theirs: every Ingress the churn creates or annotates is
checked - its configuration built aside and tested with nginx -t - which is
the 0.77 s of controller CPU (0.39 s in a run with
controller.admissionWebhooks.enabled=false, some 10 ms per check), and 155
MiB after the churn (152 MiB without the webhook). The remaining 6 MiB over
146 is more than the runs vary by; the configuration has grown since
(cf975ed34 sends the redirect to https in each location, with a location /
of its own where no path takes it; 7d11b59ab gives each config that has a
canary's upstream a canary upstream of its own), and nginx's master keeps
two configurations after a reload. Drift control on the same node and day:
ingress-nginx 4.15.1 with its metrics on, 5 runs, gave 100.70 (99.55-103.20)
µs over http and 126.02 (122.80-126.87) over https, 41 767 and 34 116 req/s -
within 2 % of the CPU of the run below (99.15, 125.62) and 1-3 % below its
req/s - so the node had not drifted and only wxingress was run again.
What the metrics cost: METRICS=off runs each controller with its metrics
off - ingress-nginx and rke2 with controller.metrics.enabled=false and
--enable-metrics=false (no monitor.call() in the log phase, no socket to
the controller, no collector), wxingress with prometheus.create=false
(-enable-prometheus-metrics=false, no location counted) - and RUNS=5
measures each scheme five times on one install. The CPU of the controller's
own process is counted beside the pod's, which splits ingress-nginx's cost
into nginx's (the Lua of monitor.call(), the batch sent over the socket)
and the Go collector's that decodes it into its histograms. Run of
2026-11-03 for ingress-nginx and rke2, of 2026-11-15 on 28f9fe23e for
wxingress (with the latency summary, 012a6cb6f), the median of 5 runs with
their range, CPU µs per request:
| ingress-nginx 4.15.1 | rke2-ingress-nginx 1.12.6 | wxingress | |
|---|---|---|---|
| http, metrics on | 99.15 (97.95-104.27) | 78.77 (74.65-80.10) | 24.72 (23.88-26.16) |
| http, metrics off | 83.94 (83.45-90.42) | 56.08 (54.76-57.84) | 24.37 (24.12-25.83) |
| http, what the metrics cost | +15.2 (+18 %): nginx 5.0, controller 10.2 | +22.7 (+40 %): nginx 10.9, controller 11.8 | within the spread (+0.4) |
| https, metrics on | 125.62 (124.18-131.88) | 133.53 (132.95-137.68) | 62.85 (62.75-63.60) |
| https, metrics off | 101.41 (98.77-104.85) | 91.91 (91.78-94.40) | 61.92 (61.61-62.36) |
| https, what the metrics cost | +24.2 (+24 %): nginx 10.7, controller 13.5 | +41.6 (+45 %): nginx 21.1, controller 20.5 | +0.9 (+1.5 %), the ranges apart |
| http req/s on / off | 43 155 / 45 946 | 58 051 / 67 749 | 161 832 / 164 190 |
| https req/s on / off | 34 531 / 38 079 | 33 440 / 41 796 | 63 629 / 64 600 |
| memory loaded, on / off (PSS MiB) | 249 / 142 | 264 / 142 | 135 / 134 |
ingress-nginx's metrics are 15-42 µs a request, 15-31 % of all it spends with them on; half to two thirds of that is its Go controller decoding what nginx sent (10-21 µs, against 0.01-0.03 with the metrics off), and they hold some 110 MiB more under load. wxingress's count in nginx's log phase is close to what these runs can tell apart: over http it stays within the spread, over https - where the runs vary less - the five runs with and without it no longer overlap, and the difference is 0.9 µs (+1.5 %), about what the +2 % instructions of the request counters and the +1 % of the upstream latency summary (012a6cb6f) measured on a trivial proxy add up to; on 751b5330a, before the summary, it was +0.8 µs with the ranges overlapping. Its controller process does no work per request either way.
Where the difference comes from:
- Requests: ingress-nginx runs Lua in every request (balancer, metrics, the configuration of the request) and sends every request's metrics over a socket to its Go controller - the endpoint churn makes no reload in any of the three, so the controller CPU of that row is what the controllers spend while traffic flows and endpoints change. wxingress's upstreams are nginx's own with the module's balancer where an annotation asks for one, and the metrics are counted in shared memory in nginx's log phase.
- Churn: endpoints change without a reload in all three. A new Ingress
reloads all three;
--sync-rate-limit0.3 makes the next reload wait up to 3.3 s after the last one started, which is the "first answer" row - the same in all three. A reload closes the keepalive connections of the old workers, which wrk counts as read errors (the "errors" of Ingress churn, the same in all three; a client that retries an idempotent request on a closed keepalive connection does not see them). - Memory: what was cut for it - the controller has no telemetry, no AWS
SDK, no k8s.io/apiserver (74 MB binary instead of 92), at most 4 Ps and GOGC
50; the module links libcurl statically with HTTP and HTTPS alone (the
image's libcurl brought some thirty libraries into every nginx process) and
computes what njs did, so no njs is loaded; the upstreams share one zone;
the compatibility profile keeps 64 idle upstream connections per worker and
Service instead of 320 (see ingress-nginx compatibility); HSTS is a map instead
of an
ifin every server. After 20 reloads all three carry more: nginx's master frees the old configuration only after it parsed the new one, so its heap keeps the size of two, in pieces the workers forked from it write into. wxingress's per-Ingress configuration is larger than ingress-nginx's (every Ingress has its servers and locations in nginx, where ingress-nginx's Lua keeps part of it in tables), so after the churn it was level with 4.15.1 on 751b5330a (146 against 144 MiB) and is above it on 28f9fe23e (155, 152 without the admission webhook), still well below rke2's 1.12.6. - The rest that is the same: a new Ingress waits for the reload interval in all three, and a reload closes the old workers' keepalive connections in all three.